Carnot Cycle
 |
 |
 |
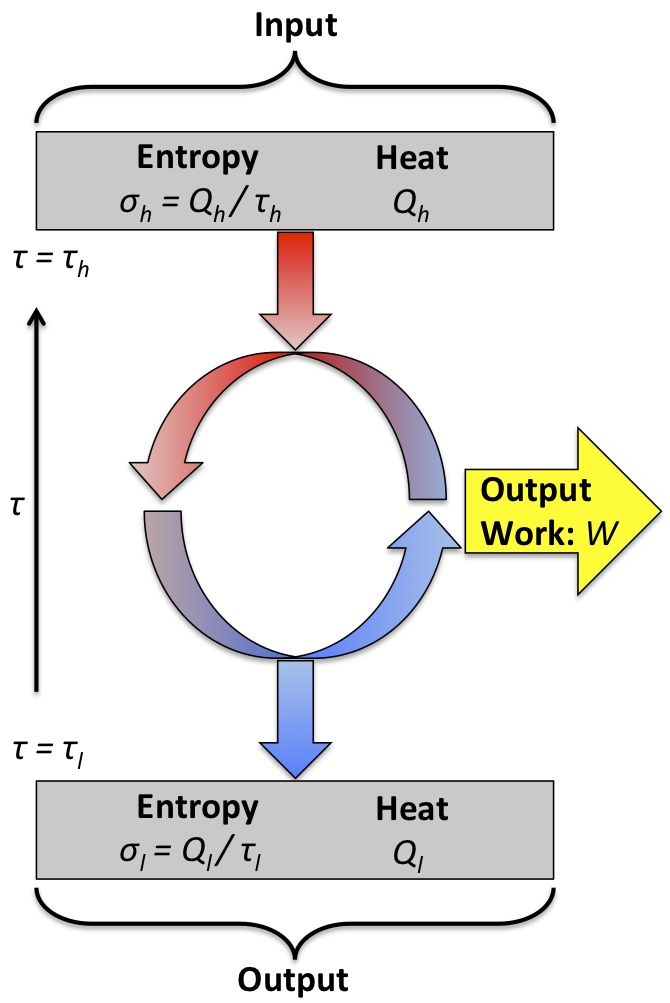
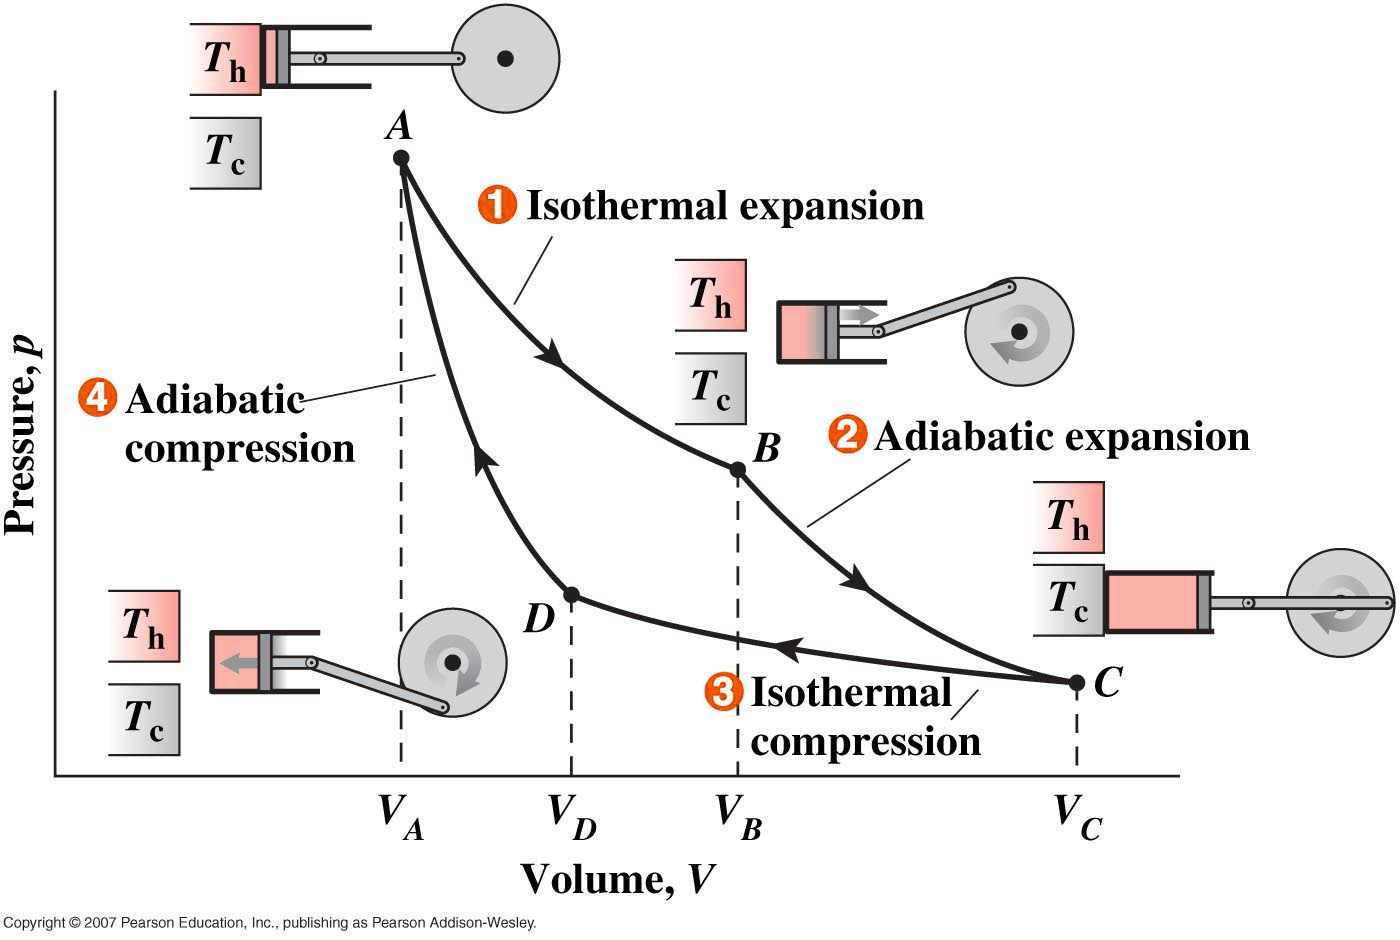
The Carnot cycle can be depicted using a pressure-volume graph which illustrates all the stages of the cycle. A Carnot engine uses a working gas to operate in a Carnot cycle, which operates between temperatures Th and Tl (Th > Tl ). The gas is isothermally expanded at Th, adiabatically expanded from Th to Tl, isothermally compressed at Tl , and then adiabatically compressed back to it’s initial temperature, Th. Carnot’s theorem states that for a heat engine operating between Th and Tl to be as efficient as a Carnot engine operating between the same two temperatures, it must operate reversibly.
Here is an interactive applet demonstrating a functioning Carnot Engine and the associated pressure and volume at different stages in the Carnot Cycle. Simply push "START" and watch the position of the cursor on the PV graph as the carnot engine runs through each of the four stages. You can slow down the play speed to watch the temperature and pressure more closely as the engine operates. The thermometer on the left shows the temperature of the heat source (which is greater than 300K only during the isothermal expansion).
You can change the values by clicking on the graph near the bottom on the left. This sets the values for P1 and V1 (initial pressure and volume). You can then check the box next to V3 and set the value (of V3) by clicking on the graph again. Press restart and the animation will run using the new values. Also note that V3 must be larger than V1.
[16]